Fundraising Effectiveness Project (FEP) Benchmarking Comparison Report
To measure and compare your organization’s fundraising gain and loss ratios year to year and against similar organizations, you can participate in the Association of Fundraising Professionals (AFP) annual Fundraising Effectiveness Project (FEP) survey. The survey collects consecutive annual data from many organizations throughout the United States. From Administration, your organization can create and run a process to compile and submit information to the AFP for the FEP survey. When you run the FEP submit process, the program compares the payment activity during two consecutive time periods, including donations and payments toward commitments such as pledges and recurring gifts, and breaks down the activity into gains and losses based on the giving behavior of the constituents associated with the revenue.
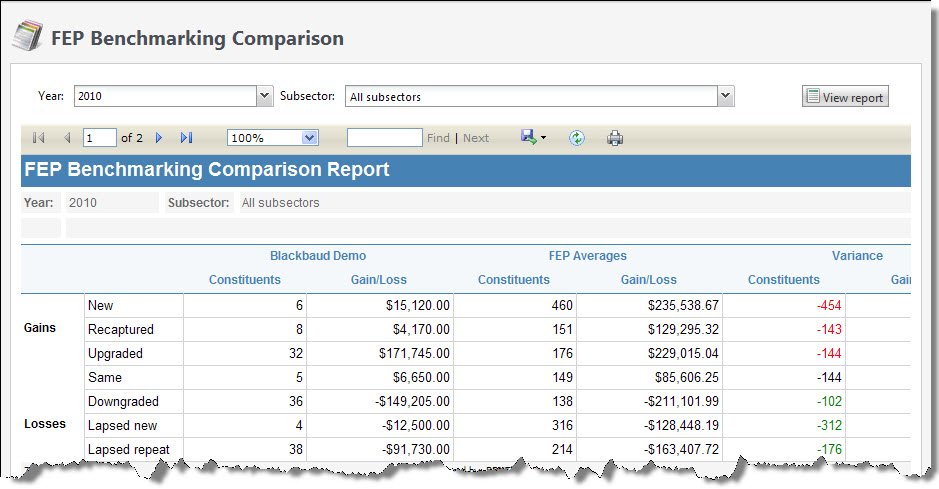
The FEP Benchmarking Comparison report shows your annual performance in comparison to the averages compiled by AFP from FEP survey participants for the same year. You can use this comparison to help identify areas to improve and to help increase revenue.
To run the FEP Benchmarking Comparison report, from Fundraising, select FEP benchmarking comparison under Reports. Select the year of the data to compare. In the Subsector field, select whether to view the averages of all verticals of FEP survey participants or only those related to a specific vertical. To include only information submitted to AFP for a specific site at your organization, in the Site field, select the site associated with the data to compare. After you select the criteria of the information to include, select View Report.
The report displays the constituent and revenue information your organization submitted to AFP for the selected year. For comparison, the report also displays the selected year’s FEP averages and the variance between the two for the various FEP statistics.
|
Category |
Description |
|
New |
Constituents with a payment transaction during, but not prior to, the selected year. The report displays this variance in red when your organization’s total is less than the FEP average, and in green when your total exceeds the average. |
|
Recaptured |
Constituents with a payment transaction during and prior to the selected year, but not during the year immediately prior to the selected year. The report displays this variance in red when your organization’s total is less than the FEP average, and in green when your total exceeds the average. |
|
Upgraded |
Constituents with payment transactions during the selected year and the year immediately prior, but with a larger payment amount during the selected year than the prior year. The report displays this variance in red when your organization’s total is less than the FEP average, and in green when your total exceeds the average. |
|
Same |
Constituents with payment transactions during both the selected year and the year immediately prior, with an equal total payment amount during each period. The report displays this variance as black, regardless of the comparison between your organization and the FEP average. |
|
Downgraded |
Constituents with payment transactions during both the selected year and the year immediately prior, but with a larger payment amount during the prior year than the selected year. The report displays this variance in green when your organization’s total is less than the FEP average, and in red when your total exceeds the average. |
|
Lapsed new |
Constituents with a payment transaction during the year immediately prior to the selected year, but not before that year nor during the selected year. The report displays this variance in green when your organization’s total is less than the FEP average, and in red when your total exceeds the average. |
|
Lapsed repeat |
Constituents with a payment transaction during and prior to the year immediately prior to the selected year, but not during the selected year. The report displays this variance in green when your organization’s total is less than the FEP average, and in red when your total exceeds the average. |
On the second page of the report, you can view bar graphs of the statistics to quickly compare your organization’s performance to the FEP averages.
You can print the report or export it in several different formats.