Event Comparison Report
The Event Comparison report compares the effectiveness of multiple events. For example, you can use this report to compare the effectiveness of an annual event over consecutive years. To open the Event Comparison report from Events, select Event comparison under Reports. The Event Comparison report page appears.
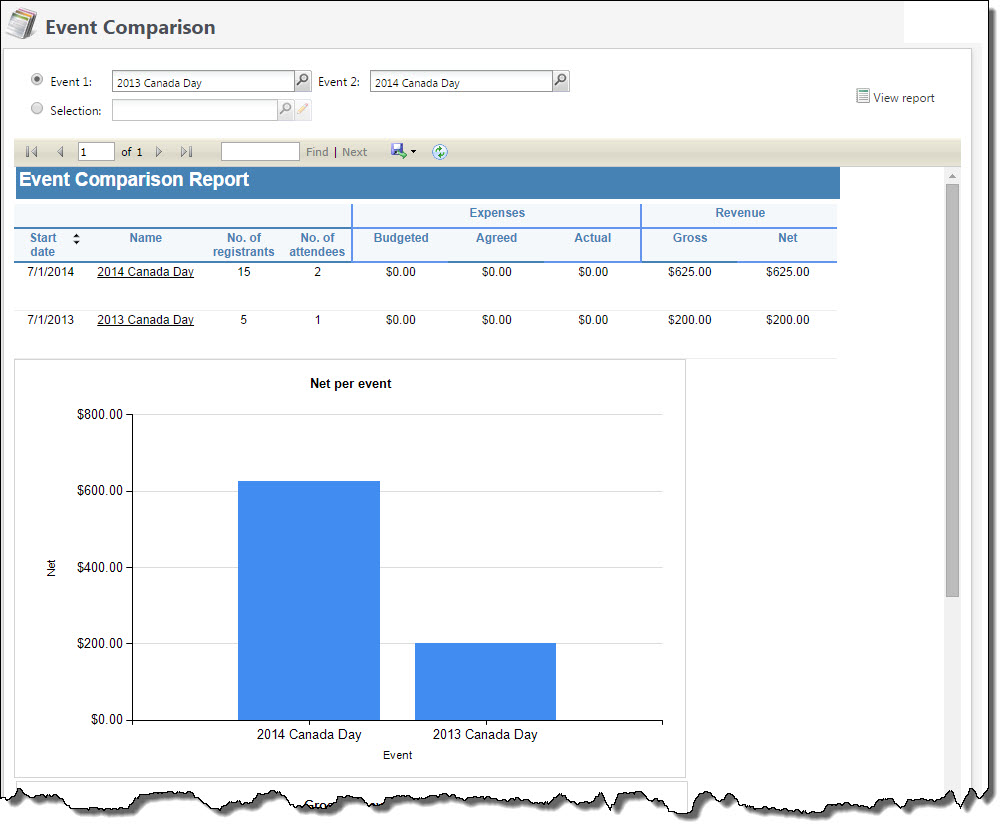
To run the report, select two events or a selection of multiple events to compare and select View Report. The report compares the performance of the selected events and displays the number of registrants and attendees, expenses, and the gross and net amounts raised for each event.
For events with a team fundraising appeal and fundraising teams, you can view additional charts to compare team fundraising effectiveness. For each event, you can view the number of teams and the total raised by each team and collectively. The report also generates charts to compare the income raised by each event and the average amount raised per team for each event.
Note: The Average Amount Raised Per Team comparison includes only donations associated with an event’s team fundraising appeal and solicitors.
You can print the report or export it in different formats.