To set up and run the Performance Comparison report, from the navigation bar, under Reports, click Performance comparison report. You use this report to see how grades for a marking column or for an assignment/category compare from one class to other classes of the same course. You can use this report to determine how well or poorly the class performs.
General
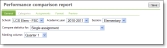
On the General tab, you select the academic year and sessions for the report. If you teach in more than one school, you also select the school. In the Compare statistics for field, you choose what you want to compare across classes such as a single assignment or class categories in a single marking column. Based on your selection, you then select one or multiple marking columns. Only schools and marking columns your supervisor gave you access to appear.
Categories
If on the General tab, Compare statistics for field, you selected to compare class categories in a single marking column, multiple assignments at one time, or class categories in multiple marking columns, you can set parameters on the Categories tab. On the Categories tab, select which categories to include in the report.

Assignments
If on the General tab, Compare statistics for field, you selected to compare a single assignment or multiple assignments at one time, you can set parameters on the Assignments tab. If you select to compare a single assignment,on the Assignments tab, search for and select an assignment to compare across classes. If you select to compare multiple assignments at one time, on the Assignments tab, enter the assignment due dates to filter assignments. Then, select which assignments to include in the comparison. The assignments available to select depend on the academic year, session, and marking columns you selected on the General tab.

Format
On the Format tab, you decide how you want to format your report. You can select to include class average, median, highest score, and lowest score.

Preview
On the Preview tab, you view your report. To view a printer-friendly version of your report, click Print. If you need to adjust the report parameters, go back to any previous tabs as much as you need and then return to the Preview tab to see if the changes created the report you wanted.
Tip: You can select, copy, and paste text from the report. For example, you can copy information from the report and paste into an email to your administrator.