Upgrading how students and parents see assignment grades
New Features
We're giving you a sneak peek at the upcoming changes and update we have cooking up for the See grade details experience from the Student Progress page.
https://d3cy9zhslanhfa.cloudfront.net/media/314ECBC4-9678-41CF-9E352DD63C518811/2B2D2D73-C72D-4C58-B919481A82D80723/webimage-C2884767-798F-462A-AF57077662B8A480.png
July 15, 2024
Over the last couple of months, the LMS team has been working on upgrading how students and parents consume assignment grades. That work has culminated in a revamp of the See grade details experience that exists on the Student Progress page. We are currently planning on releasing this update in early August, before the back-to-school season begins. As we get closer to release, we’ll update you all on our go-live in our weekly What’s New communications.
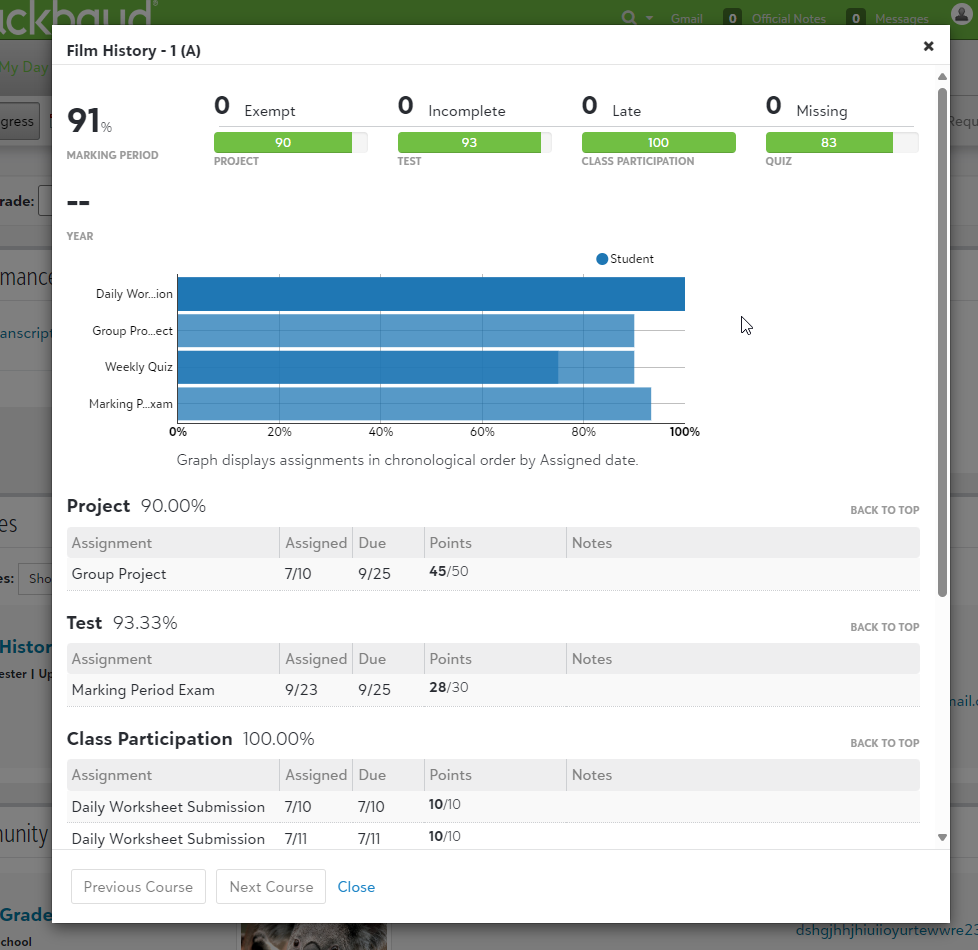
For reference, this is the current experience:

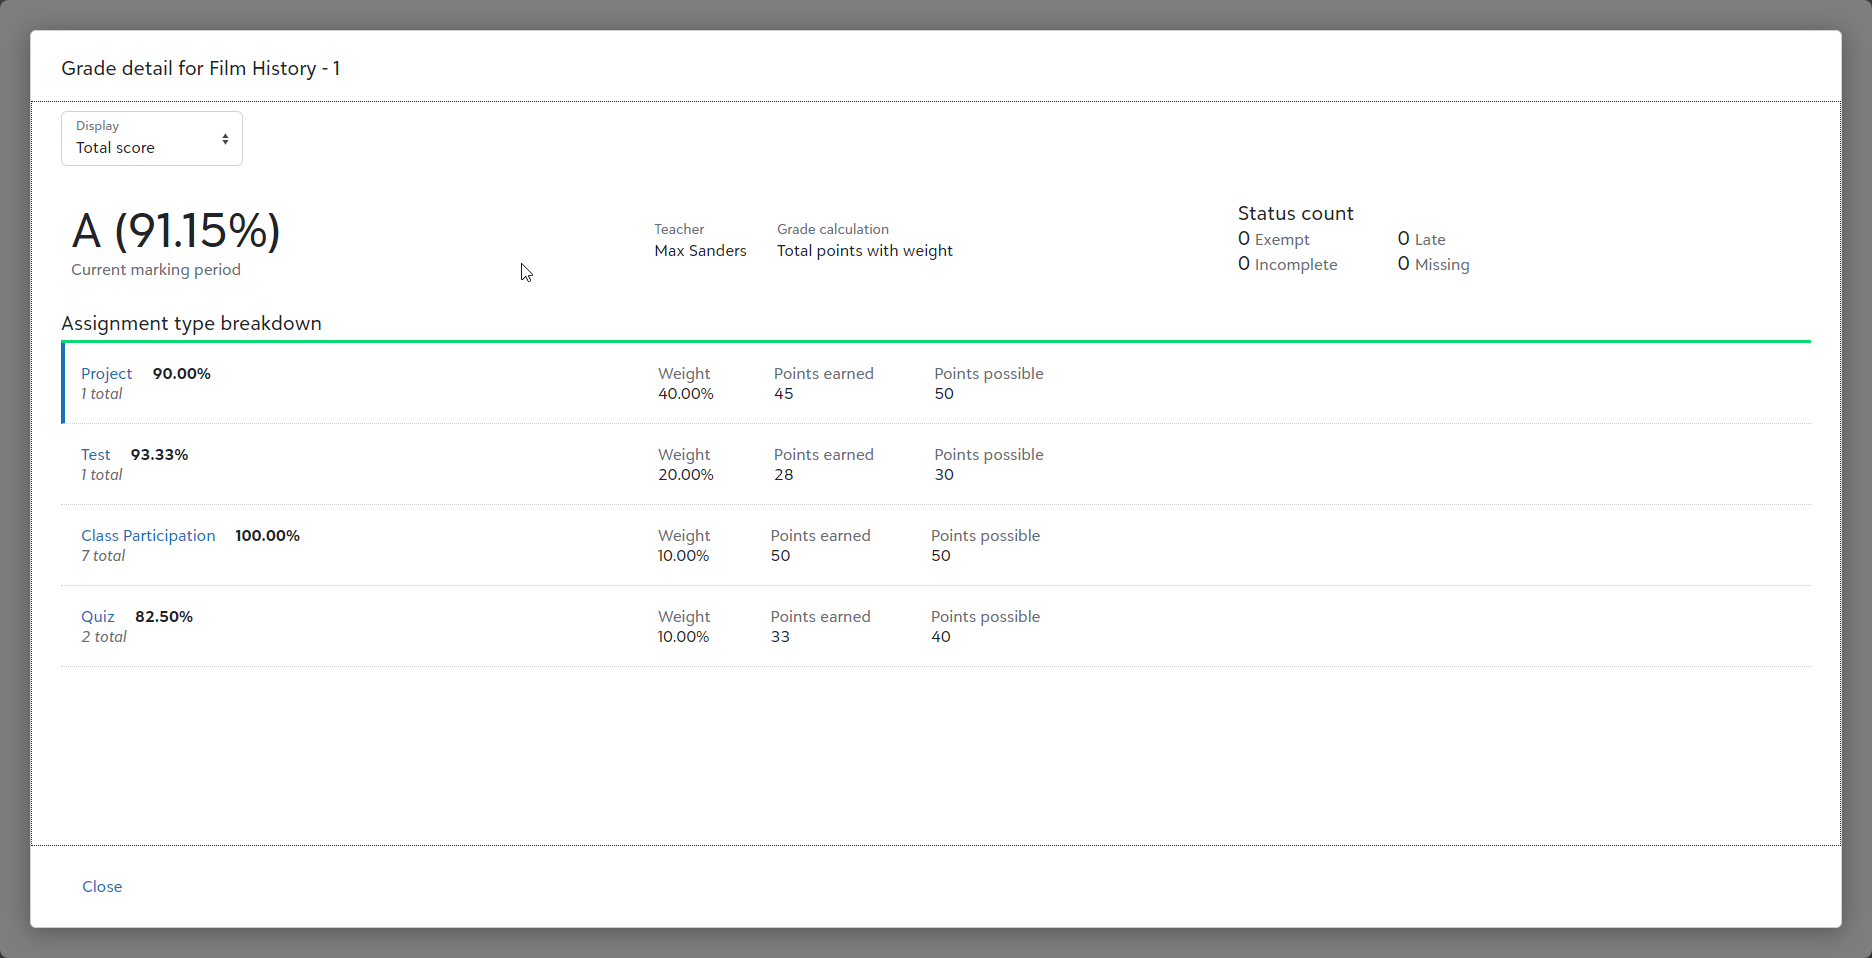
This is an example of the new experience:

With this new experience, there are a couple key problems we’re looking to solve:
-
The graph in the old experience took up a lot of space and it wasn’t immediately apparent what it was trying to communicate to students and parents.
-
Key information was missing, such as which assignments were being dropped from the cumulative calculation and which assignments were marked as extra credit.
-
Transparency around how a cumulative grade is calculated was difficult to understand.
-
Schools using a hybrid Mastery + Traditional grading method had students accessing assignment grades in multiple locations.
-
How grades displayed wasn’t customizable and didn’t always align with how schools wanted students to think about their grades.
New Experience Features
We’re implementing a couple of features with this new experience to address the problems listed above.
First, we’ve eliminated the graph. We know that visualizations are important and showcasing a student’s performance in a graph is an easy to consume way of seeing that information. In the previous experience, that graph caused more confusion than it assisted in aiding students and parents in understanding how they were performing. For now, we’ve taken out the graph while we experiment with other potential visualizations.
We also wanted to allow schools to opt into a more transparent conversation with how grades are being calculated. Because of this, it is now possible for teachers and admin to customize how certain pieces of information are displayed on a class-by-class basis. Admin can set a school level default setting, and teachers can further customize within their existing gradebook settings.
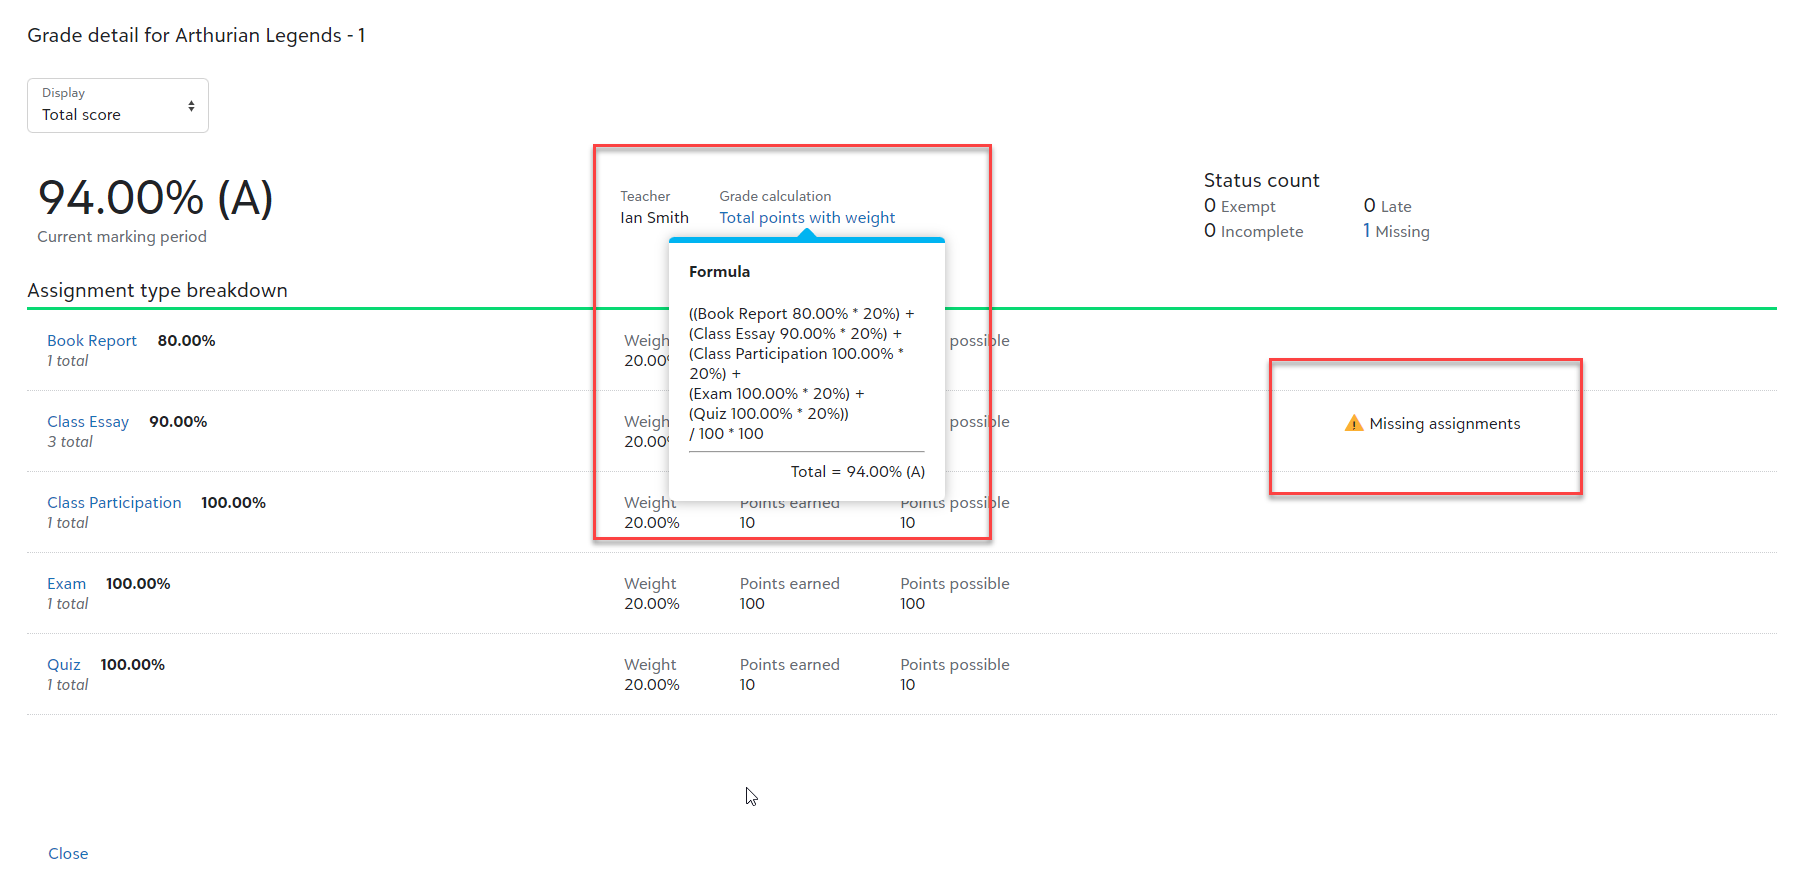
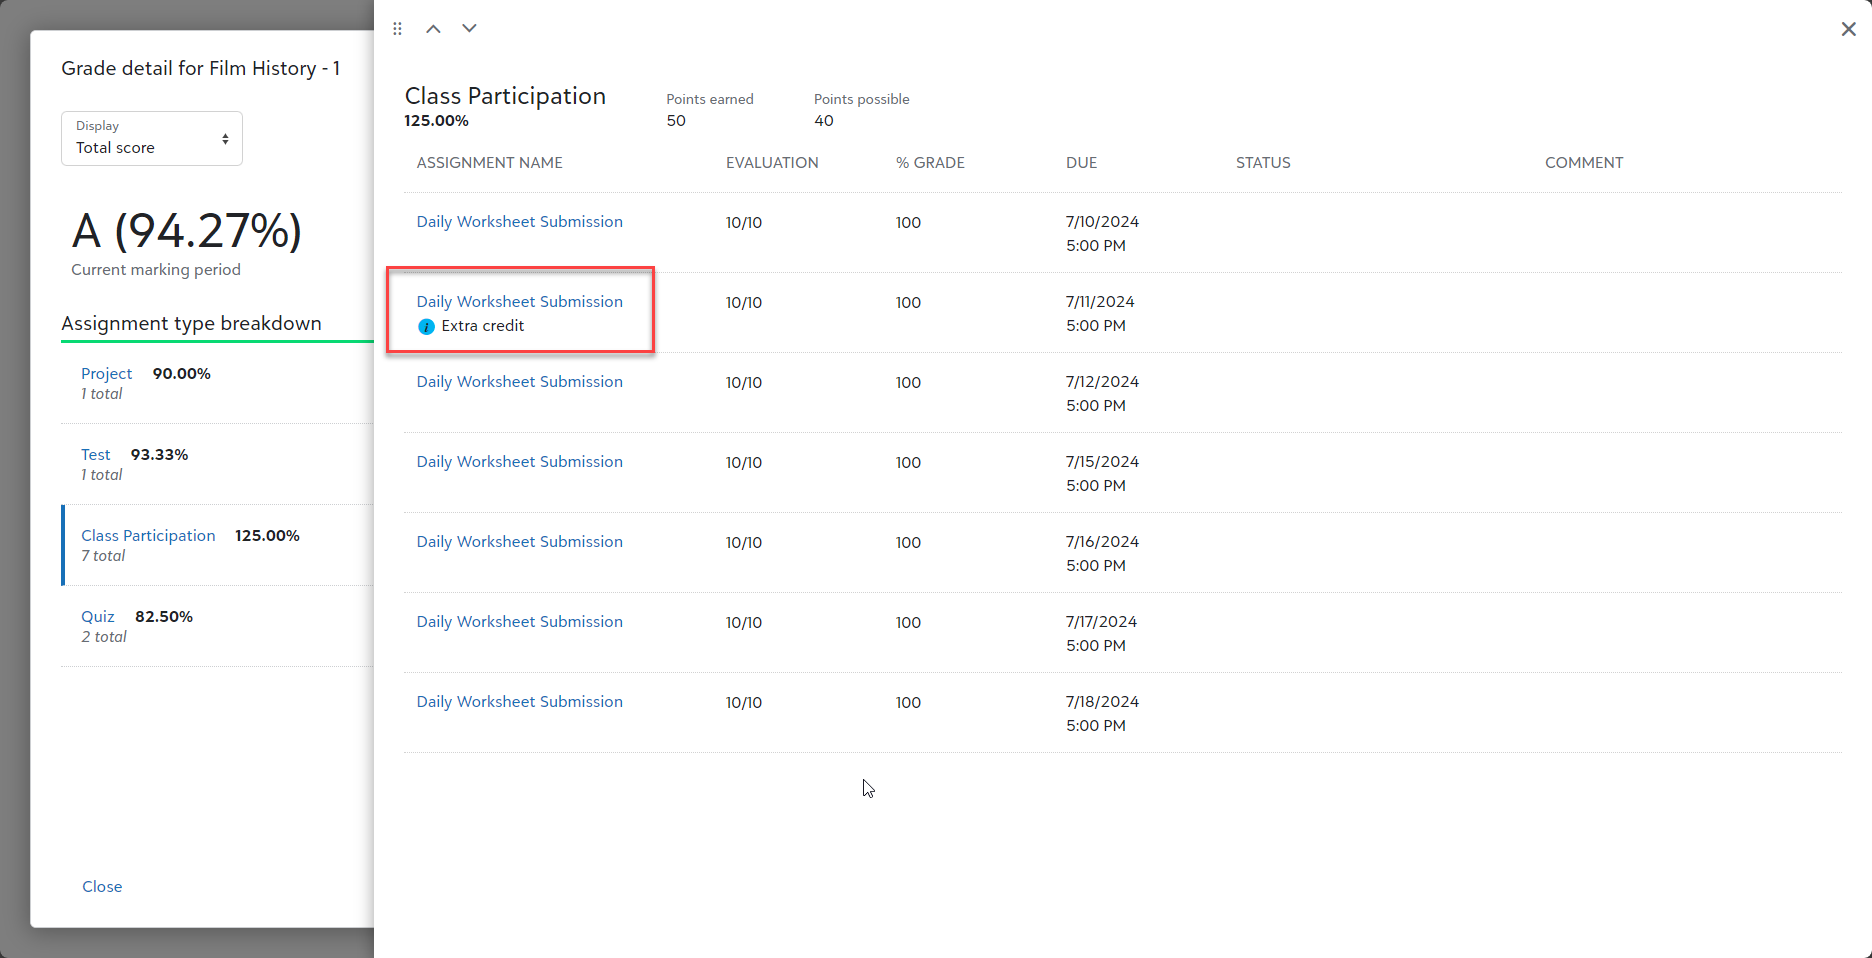
For example, you can now show a letter grade, instead of a numeric, for the cumulative/marking period value. You can also allow students to see exactly how their grade is being calculated, including the calculation method and how that calculation method is factoring in the assignment types and their weights. Students can also now clearly see which assignments were marked as Extra Credit and which are being dropped from their cumulative grade calculation.
Example of additional transparency options:

and another:

We’re really excited to get this into your hands in the near future! As always, we’ll be keeping a close eye out for feedback as these new options get utilized by you all!