Create and Configure Bar Charts
-
Navigate to the dashboard on the Home page.
-
Select the ellipsis next to the dashboard tab and then Add widget.
-
In the Add Widget screen, select an existing widget to use as a template or click on Add new widget.
-
In the next screen, configure the widget by clicking on each tab and adjust the settings.
 Details
The Details tab is where you define the data source and layout.
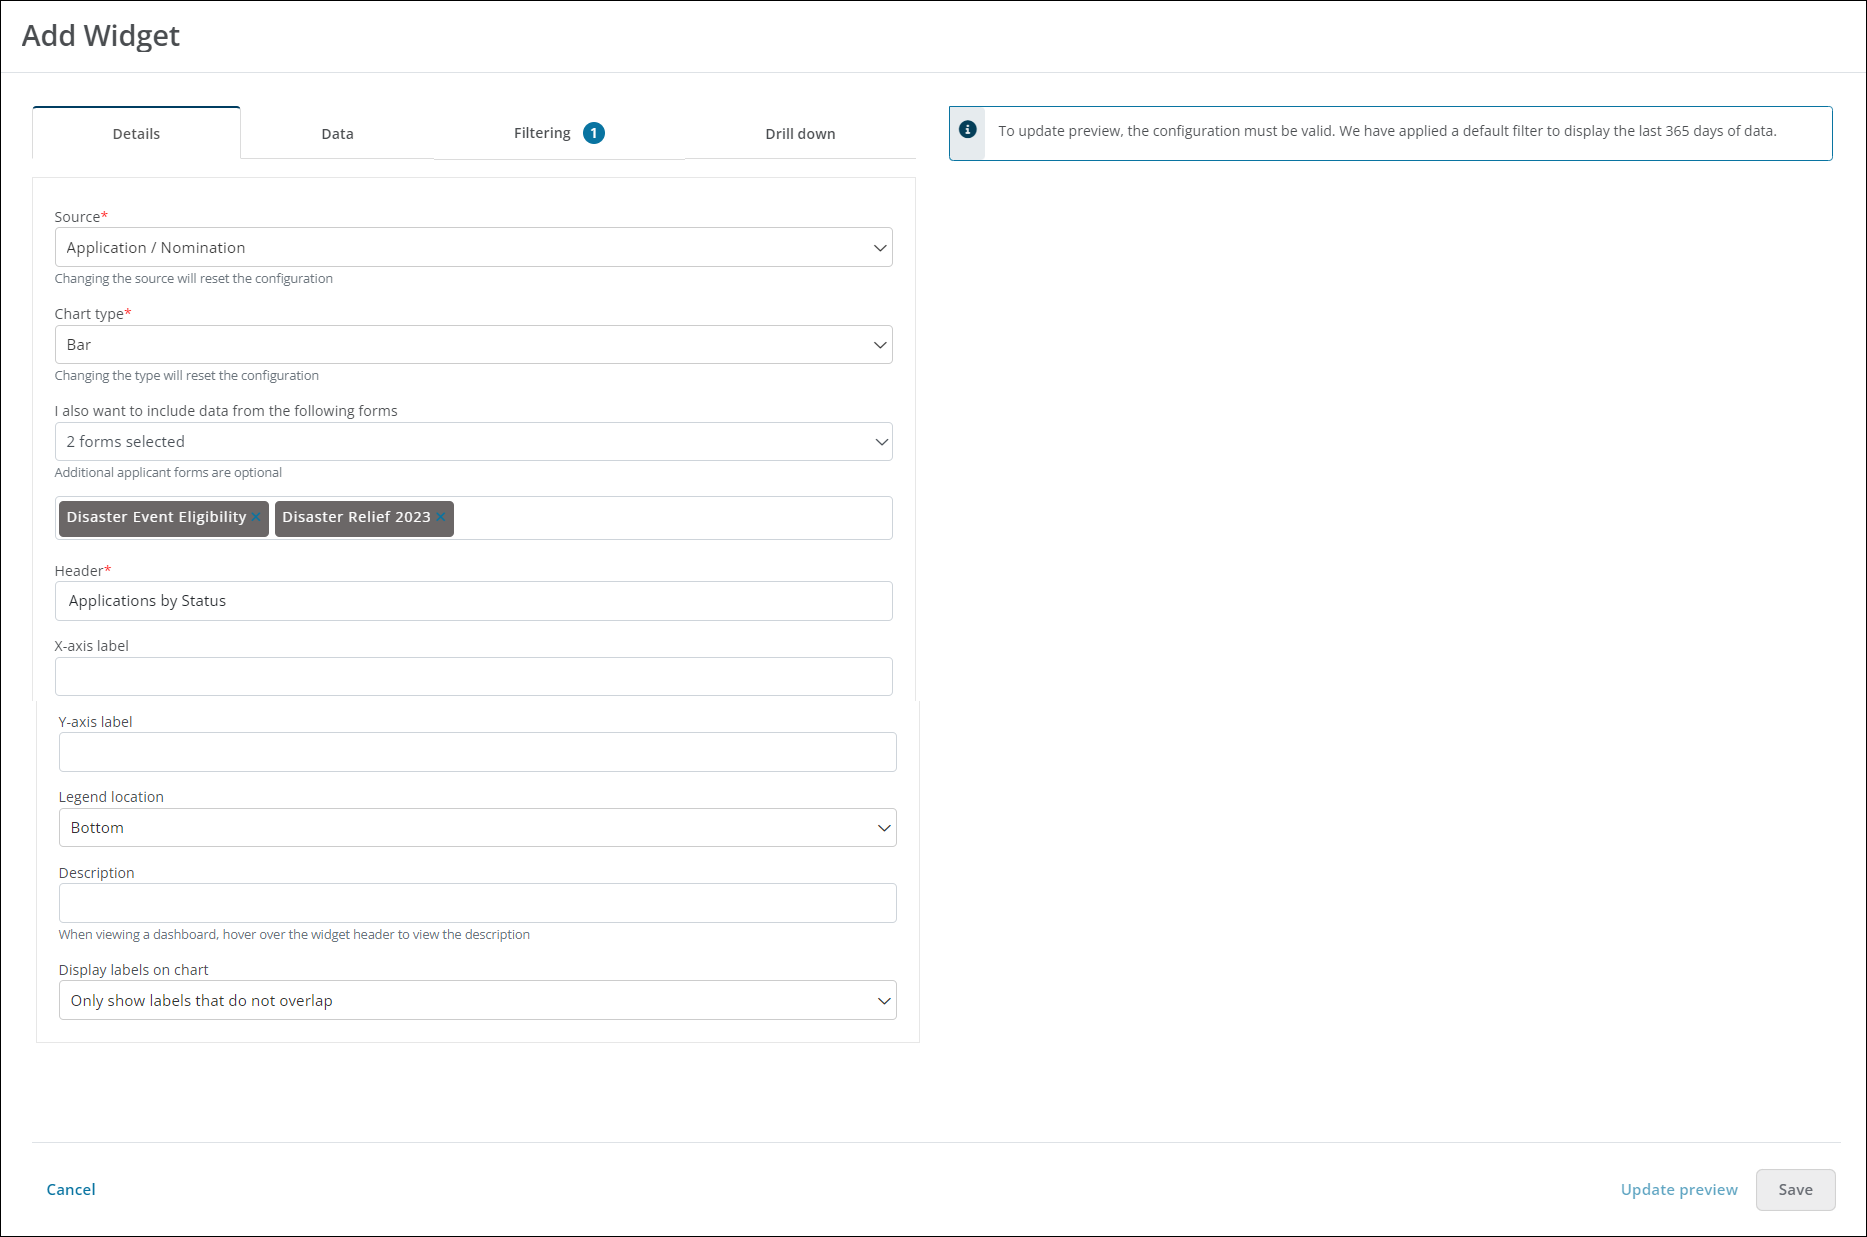
Warning: Changing the Source and Chart type fields will reset the widget's configuration.
-
Specify the type of data to display (e.g., Award, Budget, etc.) in the Source field.
-
Select Bar as the Chart type.
-
Optional - Choose any additional forms to include in the widget in the I also want to include data from the following forms menu.
-
Enter a title for the chart in the Header field.
-
Optional - Provide an X-axis and/or Y-axis label.
-
Specify the location of the legend - Bottom, Left, Right, or Top.
-
Optional - Provide a brief description.
Note: This appears when hovering over the widget as well as in the widget list in the Add Widget modal.
-
In the Display labels on chart menu, specify when values should appear on the chart as labels.
-
Always show labels
-
Always hide labels
-
Only show labels that do not overlap
Note: Depending on the size of segments in the chart, some labels may overlap with one another. It is recommended to choose Only show labels that do not overlap to only show those labels that comfortably fit within the space allowed.
-
Data
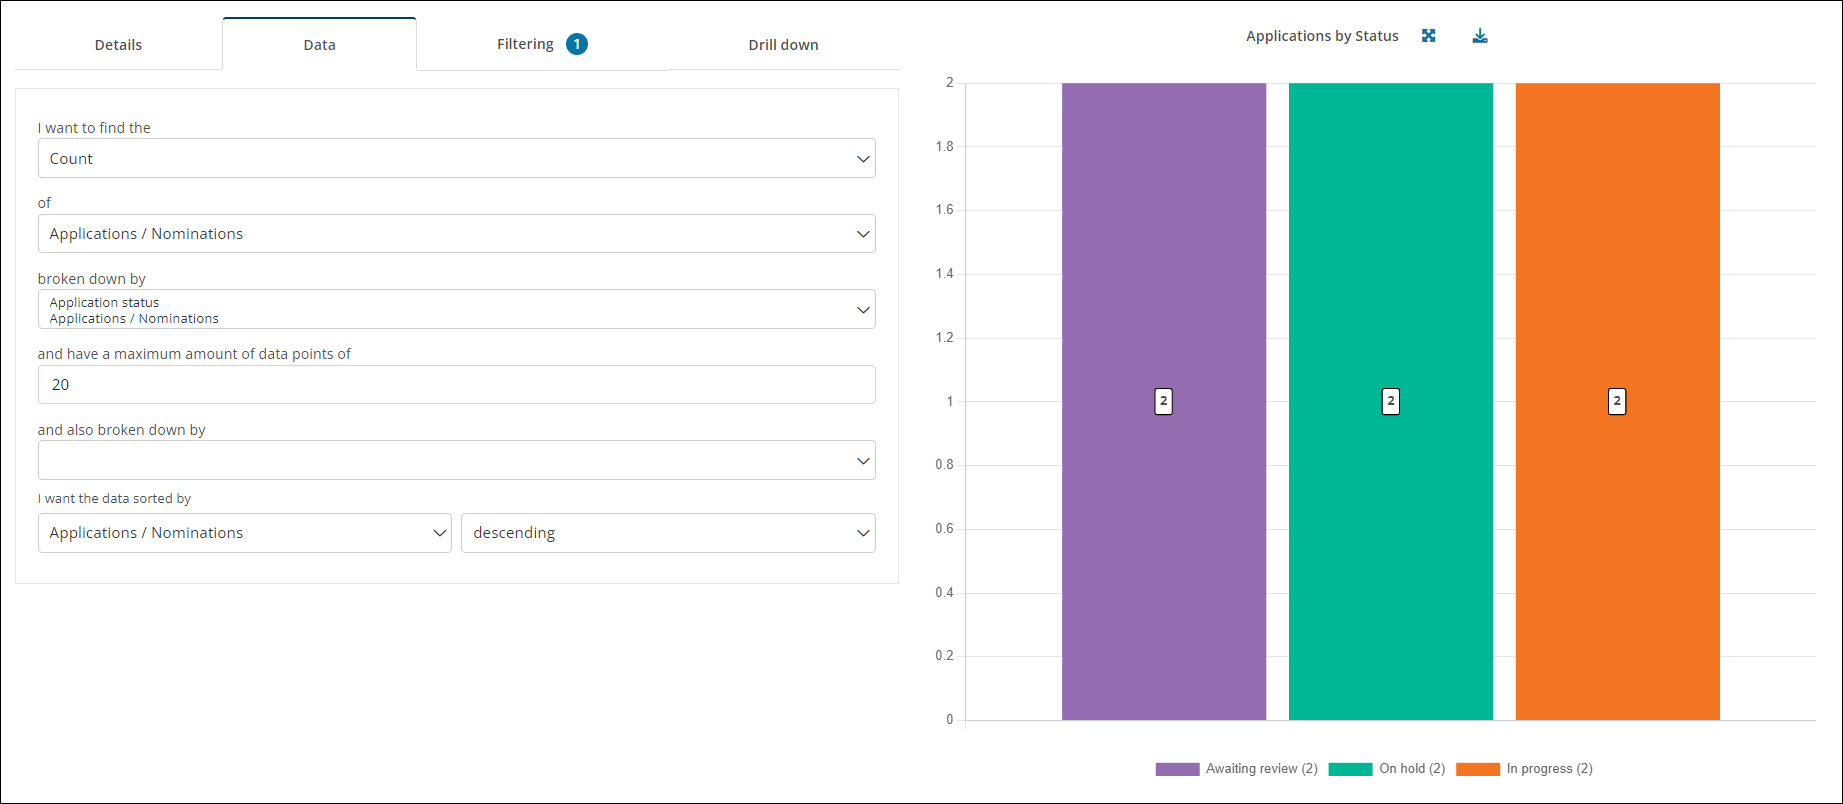
The fields in the Data tab allow you to specify the analytics to display in the widget. They are designed to act as a narrative for the analysis to be achieved. For example:
I want to find the Count of Applications / Nominations broken down by Application status and have a maximum amount of data points of 20 and also broken down by (null)*. I want the data sorted by Applications / Nominations, descending.
Note: Selecting a value for and also broken down by is optional. It can be used to further break down the first value specified (e.g., Application status).
Tip: After defining the data points, you can click on Update preview to generate a preview of the widget.
 Filtering
By default, widgets are automatically filtered for a timeframe that is applicable to the Source. For example, filtered by Submitted date is within Last 365 days. This can be updated or removed.
Note: Use the Add condition and Add rule buttons to build conditional logic for the data displayed.
Drill down
The Drill down tab can be used to define the columns to display when drilling down into the sections of a chart. This functionality is displayed as a table where each record can be selected, leading to an application record where applicable.
Note: Including a drill down table in widgets is optional.
-
-
Click Save to update the widget and return to the dashboard.