Create and Configure Table Widgets
-
Navigate to the dashboard on the Home page.
-
Select the ellipsis next to the dashboard tab and then Add widget.
-
In the Add Widget screen, select an existing widget to use as a template or click on Add new widget.
-
In the next screen, configure the widget by clicking on each tab and adjust the settings.
 Details
The Details tab is where you define the data source and layout.
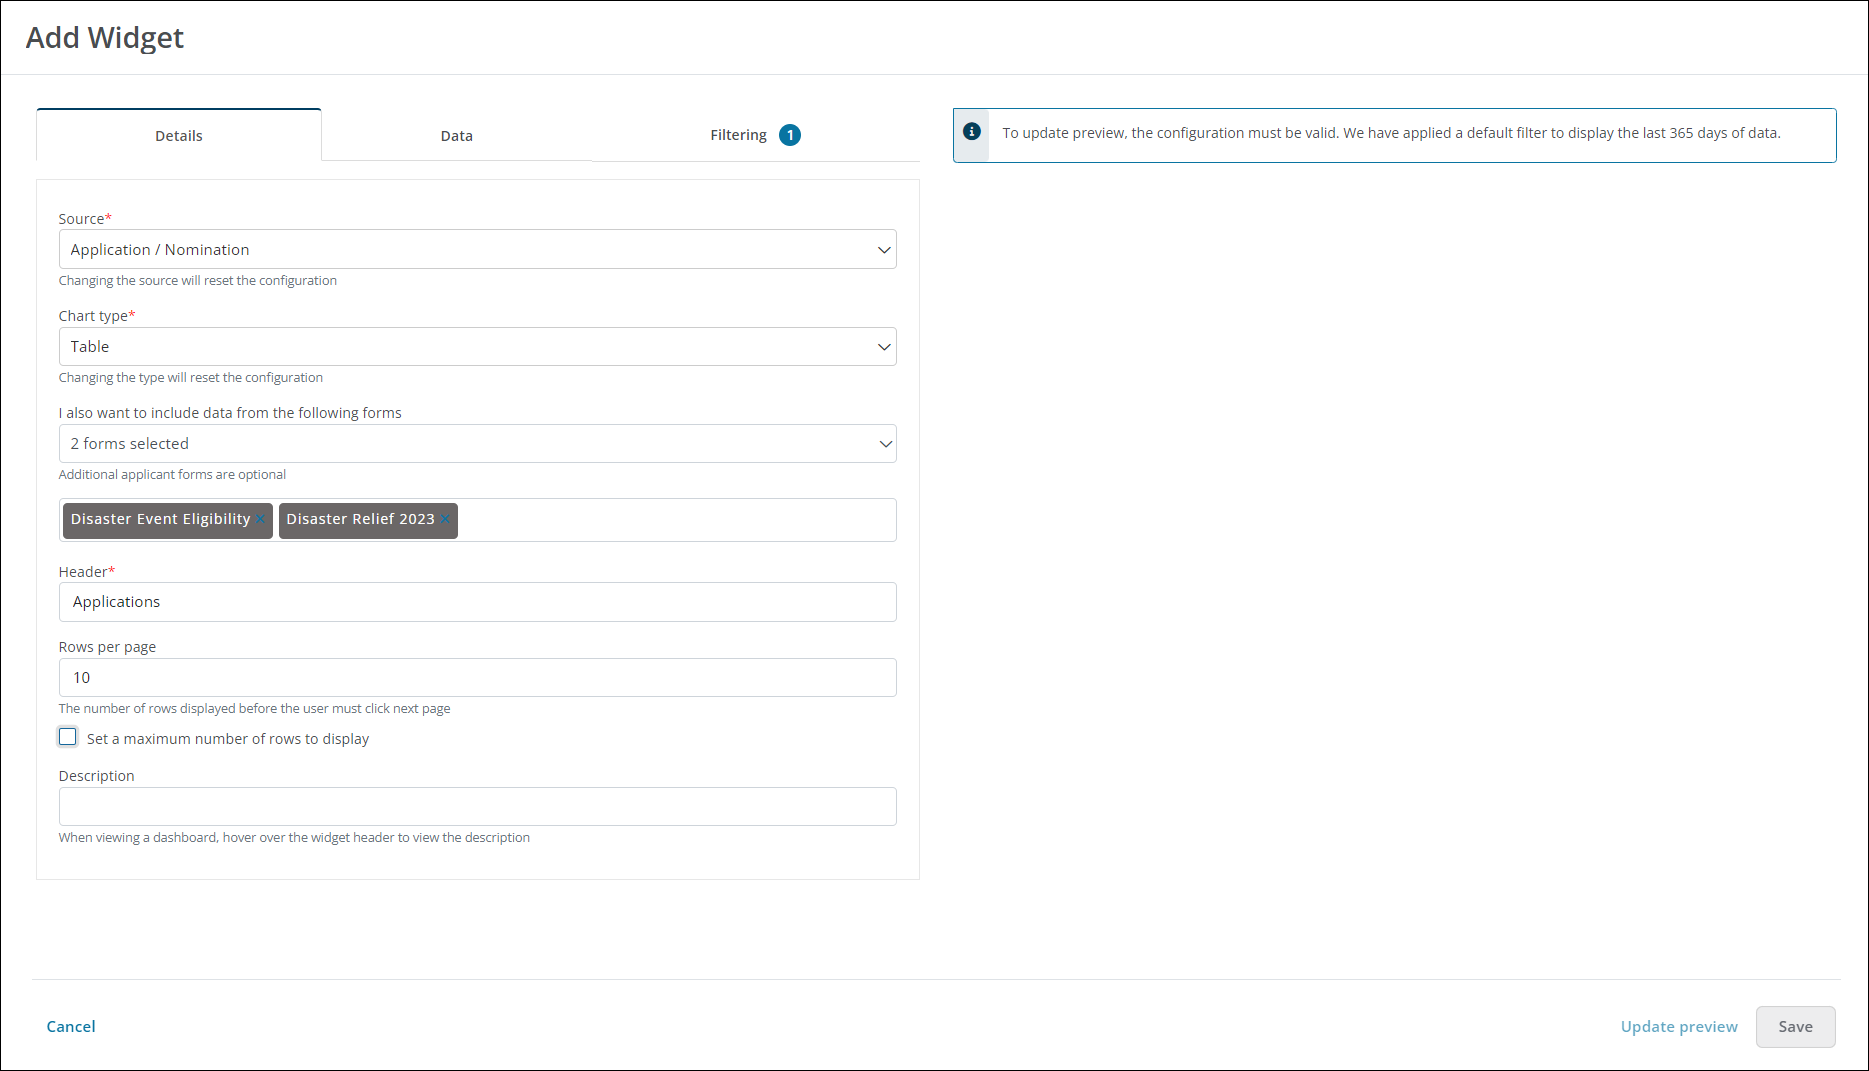
Warning: Changing the Source and Chart type fields will reset the widget's configuration.
-
Specify the type of data to display (e.g., Award, Budget, etc.) in the Source field.
-
Select Table as the Chart type.
-
Optional - Choose any additional forms to include in the widget in the I also want to include data from the following forms menu.
-
Enter a title for the chart in the Header field.
-
Specify the number of rows to display on each page in the Rows per page field.
Tip: You can also specify the maximum number of rows in the table by enabling the Set a maximum number of rows to display option.
-
Optional - Provide a brief description.
Note: This appears when hovering over the widget as well as in the widget list in the Add Widget modal.
Data
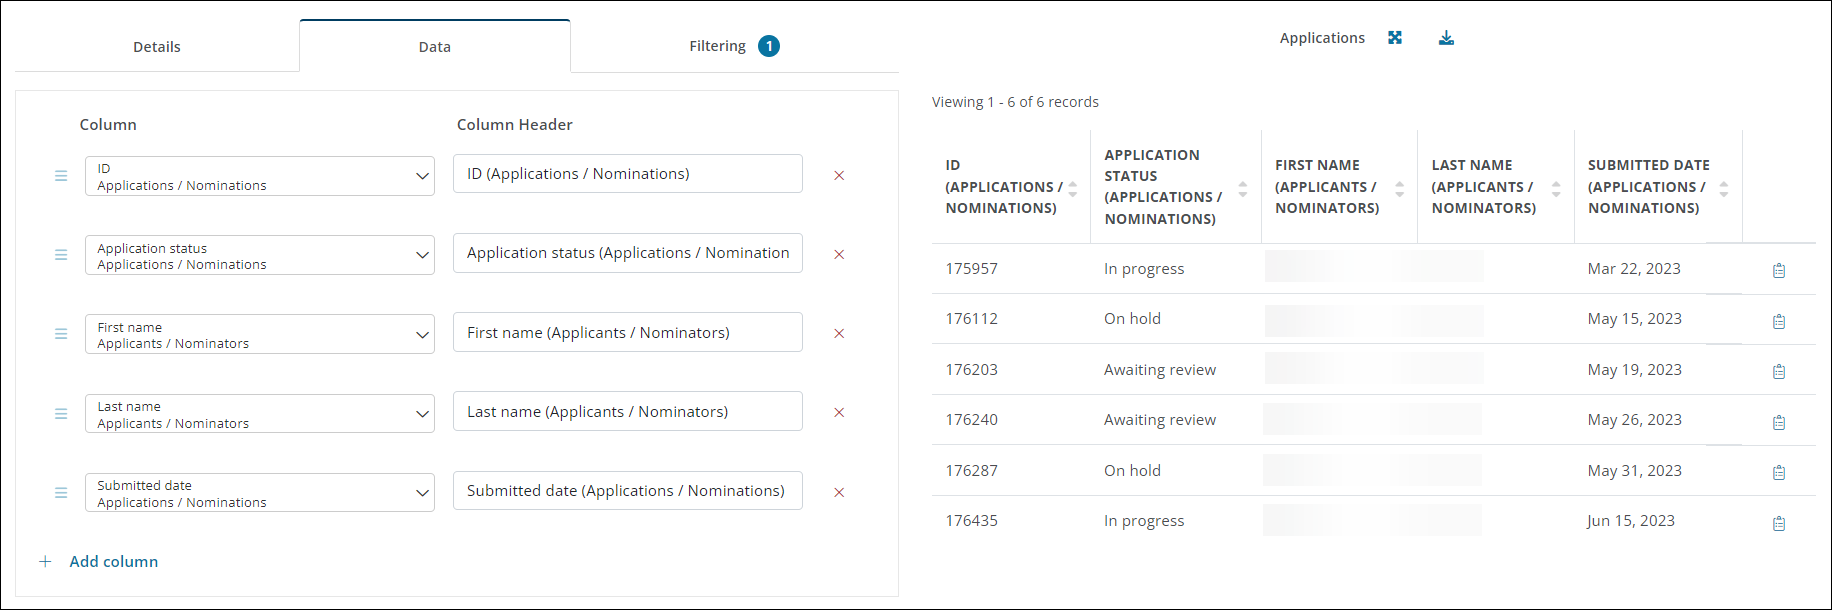
The Data tab is used to define the columns to display in the table. Click on Add column to search and select a column. The header can be updated by editing the text shown in the Column Header field.
Note: The columns available here are similar to those available for Ad Hoc reporting.
Tip: After adding columns, you can click on Update preview to generate a preview of the widget.
 Filtering
By default, widgets are automatically filtered for a timeframe that is applicable to the Source. For example, filtered by Submitted date is within Last 365 days. This can be updated or removed.
Note: Use the Add condition and Add rule buttons to build conditional logic for the data displayed.
-
-
Click Save to update the widget and return to the dashboard.