Explore Your Dashboard
Your Dashboard in NPOconnect allows you to view a breakdown of your Donations by Company and Funding Sources for a specific time frame.
-
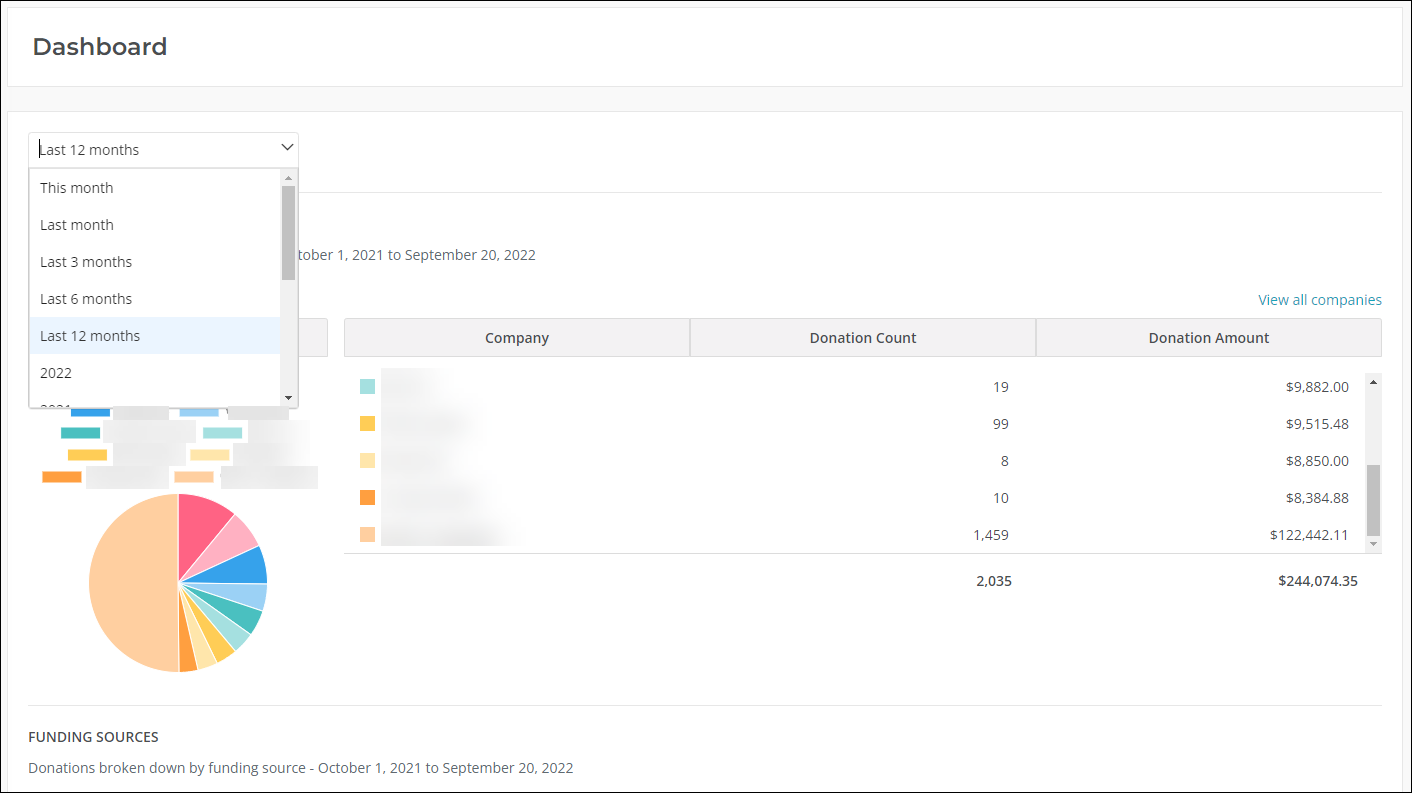
Navigate to the Dashboard area.
-
In the dropdown, select the date range you want to view.
-
This month
-
Last month
-
Last 3 months
-
Last 6 months
-
Last 12 months
-
By year (2023, 2022, etc.)
-
All time
Note: Only those years with data will appear in the bar chart.
-
Once selected, the data will automatically adjust in both the Donations by Company and Funding Sources sections.
Note: The filter applied to the data is cached so it will still be shown on the Dashboard if you leave the page and then return to it. However, it will be cleared and returned to the default view (i.e., no date range selected) if you impersonate or administer another nonprofit organization.
How to interact with the data
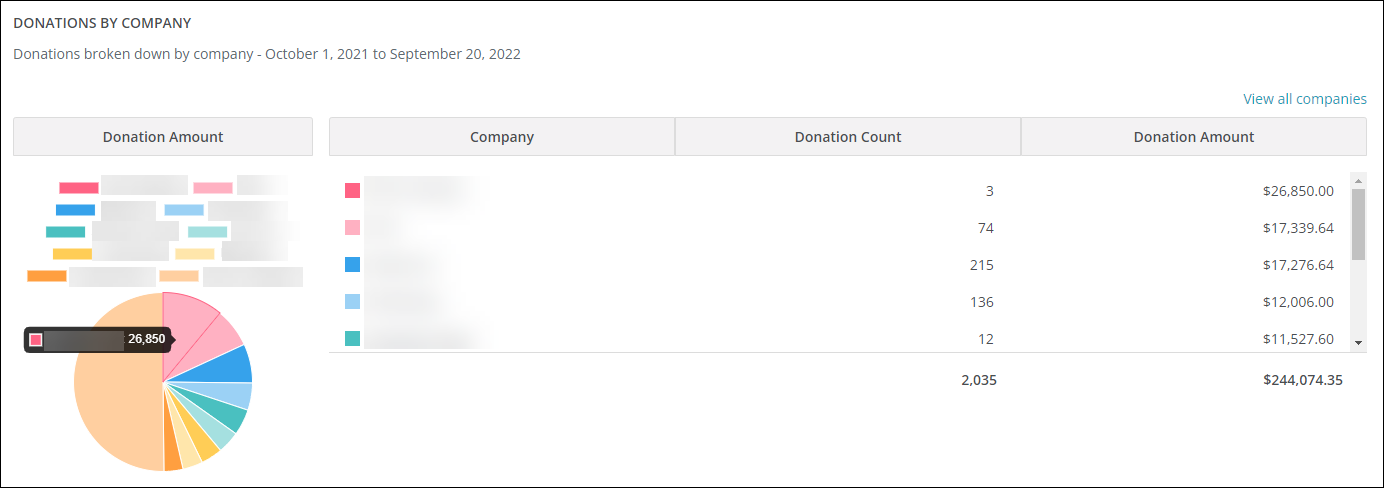
Donations by Company
The Donations by Company section shows your donations broken down by company for the specific date range. There are multiple ways you can interact with this data, including:
-
Hover over the pie chart to view the Company and Donation Amount.
-
Click on View all companies to open a new screen that shows a table view of the Company , Donation Count, and Donation Amount. Totals are not included in this view.
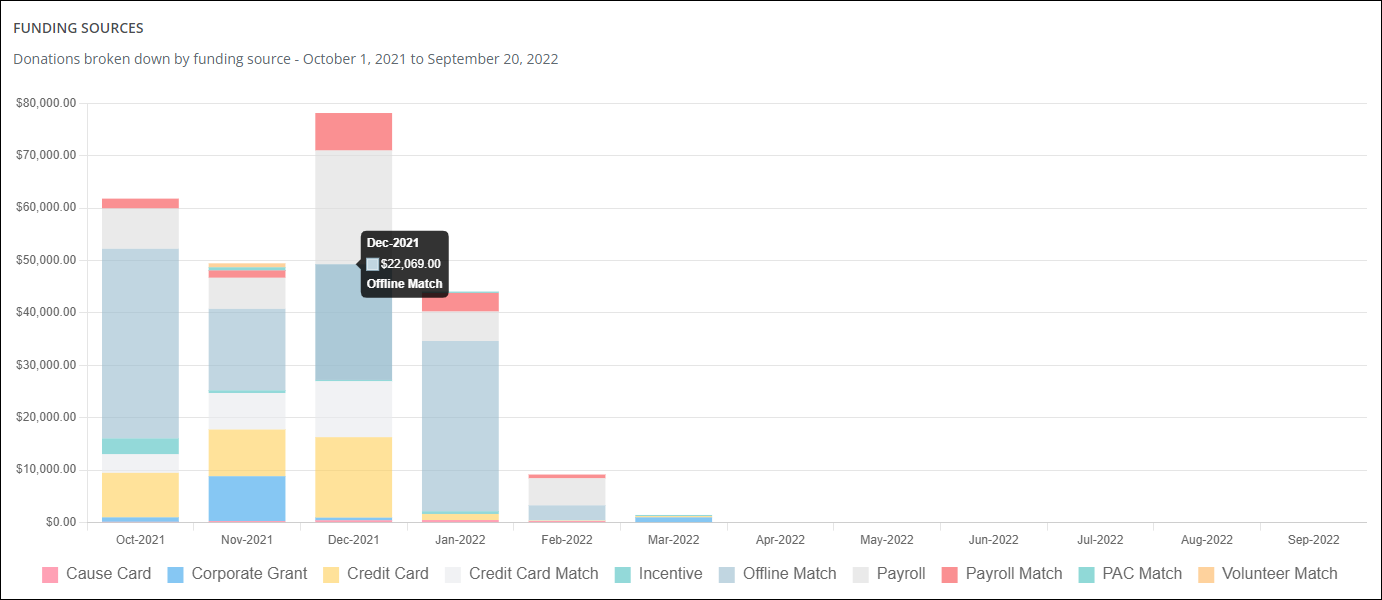
Funding Sources
The Funding Sources section shows your donations broken down by funding source for the specific date range. There are multiple ways you can interact with this data by hovering over the bar chart to view the Date, Donation Amount, and Funding Source.