Sustainer Performance
The Sustainer performance tile on the Home page provides a quick snapshot of your organization’s sustainer program health. Sustainers — donors who give on a recurring basis — are critical to building predictable revenue and long-term donor relationships. They help stabilize funding, reduce acquisition costs, and strengthen loyalty to your mission. This tile makes it easy to monitor how well your program is performing and identify opportunities to grow and retain these valuable supporters.
It displays the number of active sustainers, non-sustainers, and untapped sustainers, along with growth and retention metrics. These insights help you monitor progress toward your sustainer goals and understand how your program compares to industry benchmarks.
Tip: If your organization doesn’t yet have a formal recurring giving program, consider starting here. The Sustainer performance tile provides insights and recommendations to help you establish and monitor growth and retention rates, helping you establish and monitor a successful sustainer strategy.
Targets are set based on organizations of similar size and industry that have established sustainer programs. This approach ensures that your goals are realistic and aligned with best practices. The tile also calculates key metrics to give you a clear picture of performance. For example, the percentage of active sustainers is determined by dividing the total number of donors with recurring gift cash payments in the current calendar year by the total number of donors for the year. Monthly percentage change reflects the difference between last month’s number of sustainers and this month’s number. The active sustainers Goal on the tile indicates your organization's target based on benchmarking.
The tile includes additional metrics to help you analyze trends. Sustainer growth rate measures the year-over-year change in the number of sustainers. Sustainer retention rate calculates the percentage of last year’s sustainers retained this year. Positive growth and retention rates indicate program health, while negative rates highlight areas for improvement.
Data in the tile refreshes weekly, and you can use the date picker to view metrics for different years.
Tip: The information shown during the first two months of the calendar year may not provide actionable insights due to limited data. More meaningful year-to-date insights will be available starting in March. You can still review data from previous calendar years at any time.
Understanding these metrics helps you track program health, identify opportunities to grow your sustainer base, and improve retention while reducing attrition.
Interactive Chart Features
You can interact with the doughnut chart on the Sustainer performance tile to gain deeper insights into your donor base:
-
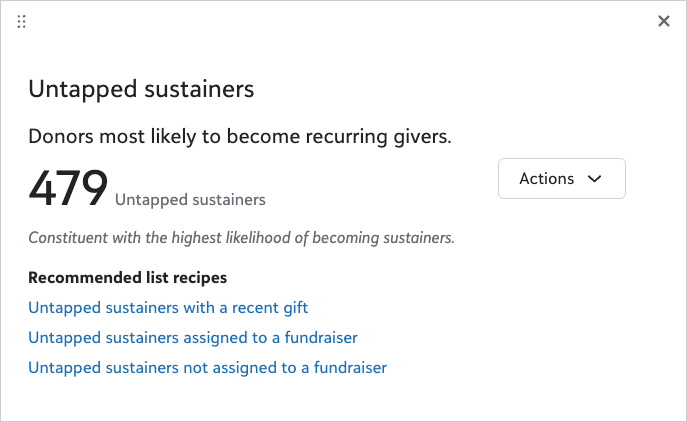
Untapped sustainers: Select this segment to open a modal that shows how many current donors in your database have the highest likelihood of becoming sustainers. You’ll also see recommended lists to help you identify and cultivate these donors into active sustainers. This feature empowers you to focus on high-potential relationships and grow your program strategically.
-
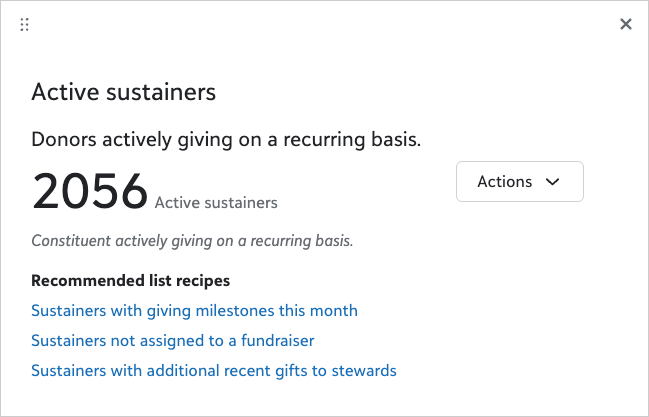
Active sustainers: Select this segment to open a modal that displays donors who currently give recurring gift cash payments. Lists are provided to help you continue cultivating these key relationships, reinforcing loyalty and strengthening long-term engagement.
These interactive features are designed to help you take action — not just track metrics. By using the recommended lists and insights, you can prioritize outreach and build stronger, lasting connections with donors who sustain your mission.
Key terms
-
Current donor: A donor who has made any type of cash gift during the year.
-
Untapped sustainer: A donor who has not yet made a recurring gift in the calendar year but has a high likelihood of conversion.
-
Active sustainer: A donor who has made recurring cash gift payments during the current calendar year.
-
Sustainer Growth rate: Measures how much the number of sustainers has increased or decreased compared to last year.
-
Retention rate: Measures the percentage of sustainers from last year that have continued giving this year.
Turn Benchmarks into Action with AI Guidance
The Sustainer performance benchmarking tile now integrates with Chat for Blackbaud AI to help you move from insight to action. Instead of just showing how your sustainer program compares to peers, this experience gives you real‑time, personalized guidance to improve growth and retention.
Tip: This capability is a Premium feature. See how to check whether your account includes Premium features to confirm access
With AI guidance, you can:
-
Understand how your sustainer growth and retention are trending over time
-
Interpret benchmark performance with clear, contextual insights
-
Receive tailored recommendations based on your organization’s data and peer benchmarks
For example, if your sustainer growth or retention rate falls below key benchmark thresholds, Chat for Blackbaud AI might suggest focusing on high‑likelihood untapped sustainers, strengthening onboarding and stewardship for new sustainers, or testing changes to gift amounts, cadence, or messaging. These recommendations are curated for your specific benchmark cohort, so they’re practical, relevant, and designed to drive measurable improvement.
Select Suggest actions to see your next best move and turn benchmark insights into meaningful progress for your sustainer program.
What is benchmarking?
Benchmarking helps you understand how your organization’s fundraising performance compares to similar organizations. Unlike arbitrary goals, peer-based benchmarks are grounded in real-world data, making them more relevant and motivating.
Why Benchmarking Matters
-
Accounts for sector-specific dynamics and donor behavior
-
Normalizes for organizational scale
-
Reveals actionable gaps and strengths
Raiser’s Edge NXT uses the Blackbaud Philanthropic dataset — the largest of its kind — to derive benchmarks from billions of dollars in giving across thousands of organizations.
How It Works
Your organization is grouped with peers based on:
-
Country (U.S. or Canada)
-
Industry/Sector (e.g., Higher Education, Healthcare)
-
Annual Revenue Size (Small: <$1M, Medium: $1M–<$10M, Large: ≥$10M)
Benchmark scores are calculated at various percentile ranges (i.e., 10th, 50th, 90th, etc). using all organizations in a peer group and weighted to reflect the nonprofit landscape. Your performance is compared separately to industry and revenue size benchmarks, then averaged into a combined integer score from 0 to 10.
By comparing your results to similar organizations, benchmarking highlights where you excel and where improvement is needed—helping you set realistic goals and adopt strategies that drive growth.
For consistent comparison across organizations, benchmarks include: