Campaign Email Trends
The Campaign Email Trends graph show the data for this email campaign for the past 6 months of activity.
Note: If a month has no email activity, the dates shift automatically to capture 6 months of activity.
Hover over points to view statistics for that trend:
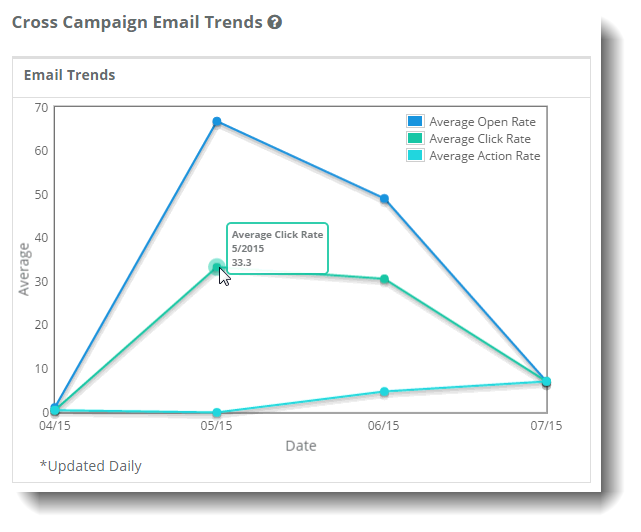
Average Open Rate
Average number of email opens for this campaign for the last 6 months of activity.
Average Select Rate
Average number of times that recipients selected on links contained within an email for this campaign
Average Action Rate
Average number of people who received the message and completed an action on the message such as social sharing, making a donation, or taking a survey for this campaign
What if I only see points?
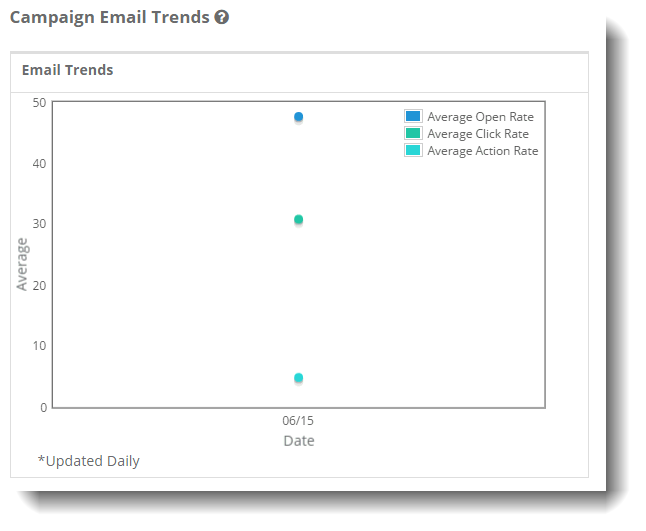
Line graphs compare monthly data. If only one month of data is available, only points display. Hover over a point to view detailed statistic information for that month.