Fundraising Analysis Report Samples
The first three sample reports illustrate analyzing the same fundraising data in three different ways using the various features that the Fundraising Analysis Report provides. The fourth example uses Source Code data and shows the pie chart format.
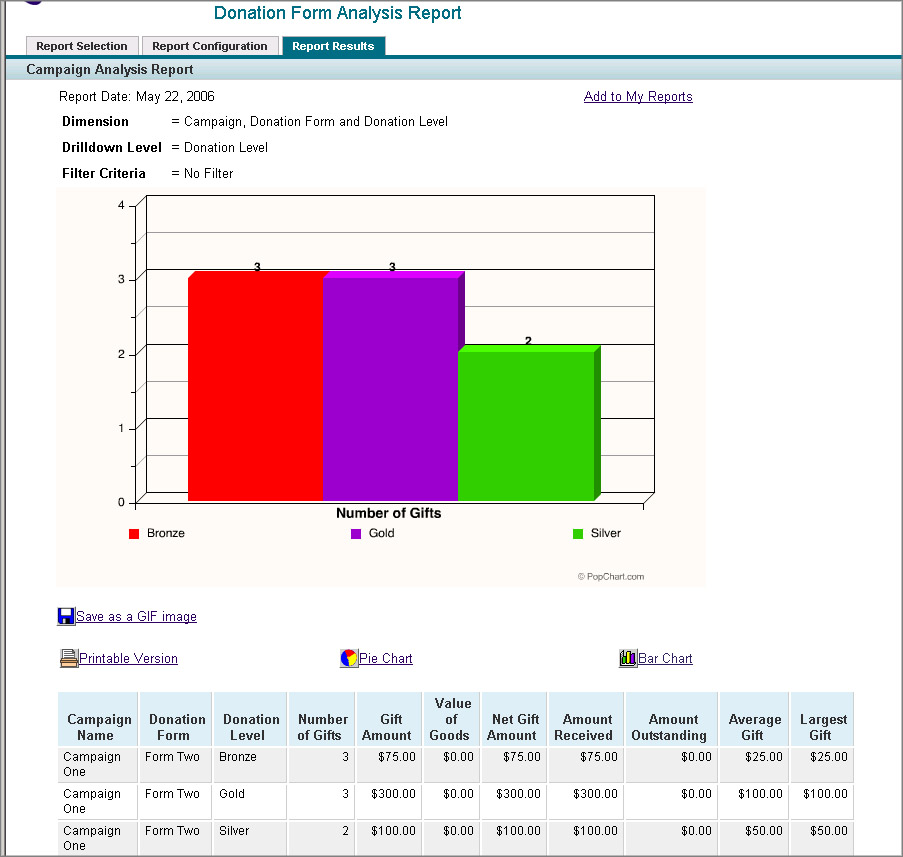
This sample shows the bar chart representation using Analyze by Donation Form and Donation Level as the Dimension. The appropriate headings were selected to chart the Donation Level vs. the Number of Gifts.
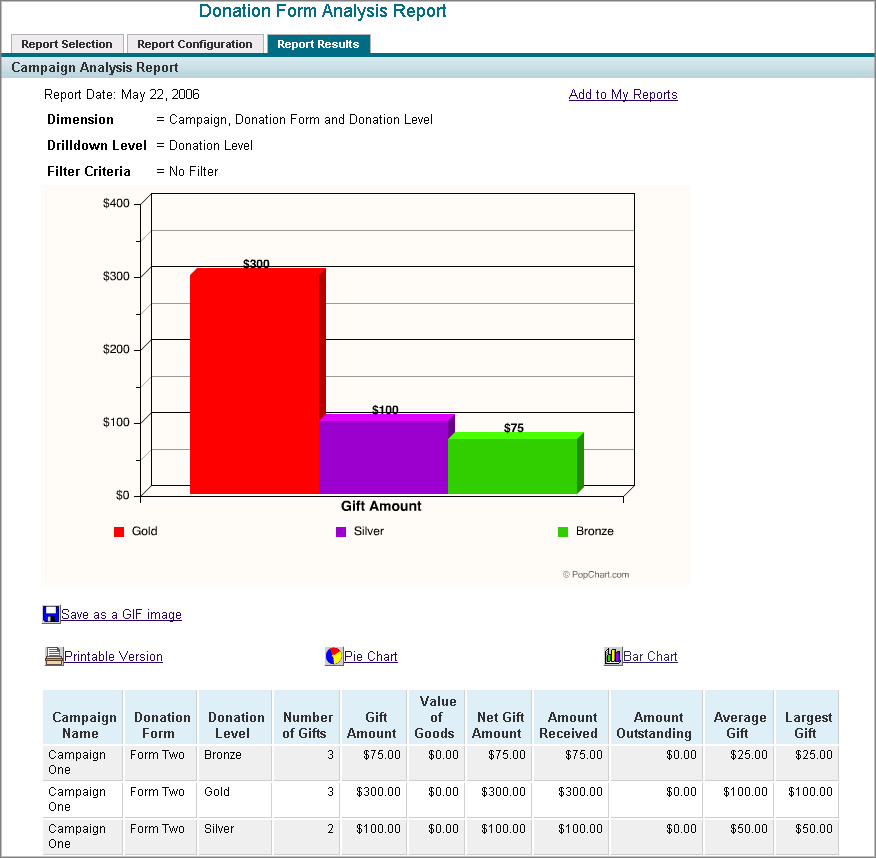
This sample shows the bar chart with the same Dimension for Analysis (Donation Form and Donation Level), but using the Donation Level vs. the total Gift Amount for each level by selecting on the appropriate headings in the data table at the bottom of the report.

This sample shows the bar chart using Analyze by Geography as the Dimension for the report. For the chart view, the appropriate headings to chart the State (of residence of the donors) vs. the Average Gift amount were selected.
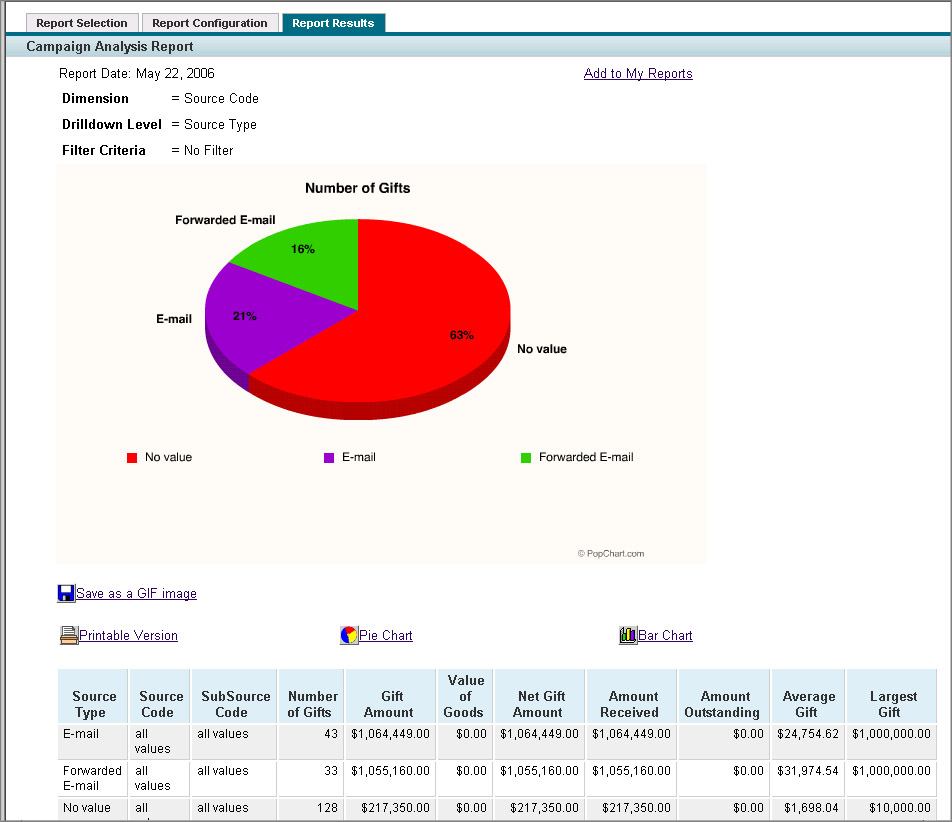
This sample shows the pie chart representation using Analyze by Source Code as the Dimension for the report. For the chart view, the appropriate headings to chart the Number of Gifts vs. the Source Type (Email, Forwarded E-mail, and Other) were selected.