On the Blackbaud application start page, click Utilities. The Utilities, Gadgets and Reference page appears.
Under ClickOnce Utilities, click Blackbaud SQL Snapshot Utility.
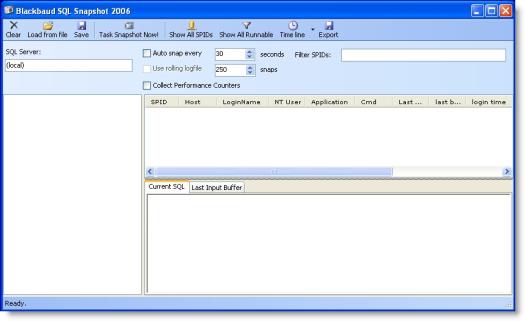
The utility downloads, and a security warning confirms that you want to run the application. Click Run. The Blackbaud SQL Snapshot 2006 screen appears.
In the SQL Server field, enter the server to monitor. The default is “(local).”
Note: To monitor activity with the SQL Snapshot Utility, you must have administrator rights on the SQL server.
After you specify the server, several options are functions available.
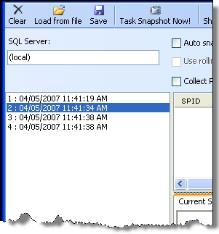
To manually take a snapshot of the server’s SQL activity, click Task Snapshot Now! Captured snapshots appear in the pane on the left side of the screen.
To automatically take snapshots of activity on a regular basis, select Auto snap every and enter the number of seconds between snapshots in the field.
To limit the number of snapshots taken automatically, select Use rolling logfile and enter the number of snapshots to take in the field.
To collect SQL and Machine/NT performance counters, select Collect Performance Counters. To view this information, double-click a snapshot in the pane on the left side of the screen.
To view activity information for a snapshot, select it in the pane on the left side of the screen. The activity information appears in the grid on the right.
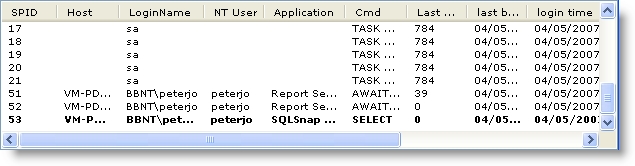
To view the SQL command processed by the client and the data from the client that triggered the activity, select an item in the grid on the right. Detailed information appears on the Current SQL and Last Input Buffer tabs. The Current SQL tab displays the SQL command processed from the client, in context. The Last Input Buffer tab displays the data sent from the client that triggered the activity. By default, only active SQL activity appears.
To make all SQL activity visible, click Show All SPIDs.
To view all activity based on status, click Show All Runnable.
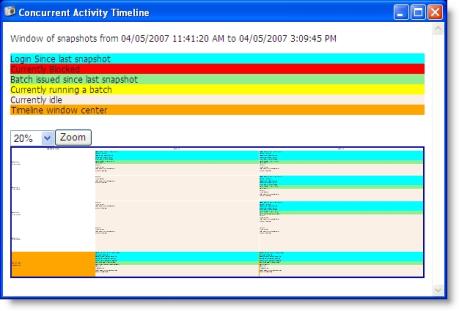
To view a graphical representation of the captured snapshots, click Time line and select Time line (connections with activity) or Time line (all connections).
To filter activity by SPID, enter the SPID number to view in the Filter SPIDs field. To view multiple numbers, enter them in a comma-separated list.