Reports and Dashboards
Below is a deep dive into the Google Analytics (GA) anatomy features. For a faster introduction, take Google's tour by selecting the overflow menu ![]() icon by your profile picture in the upper, right corner of your GA home screen.
icon by your profile picture in the upper, right corner of your GA home screen.
Home
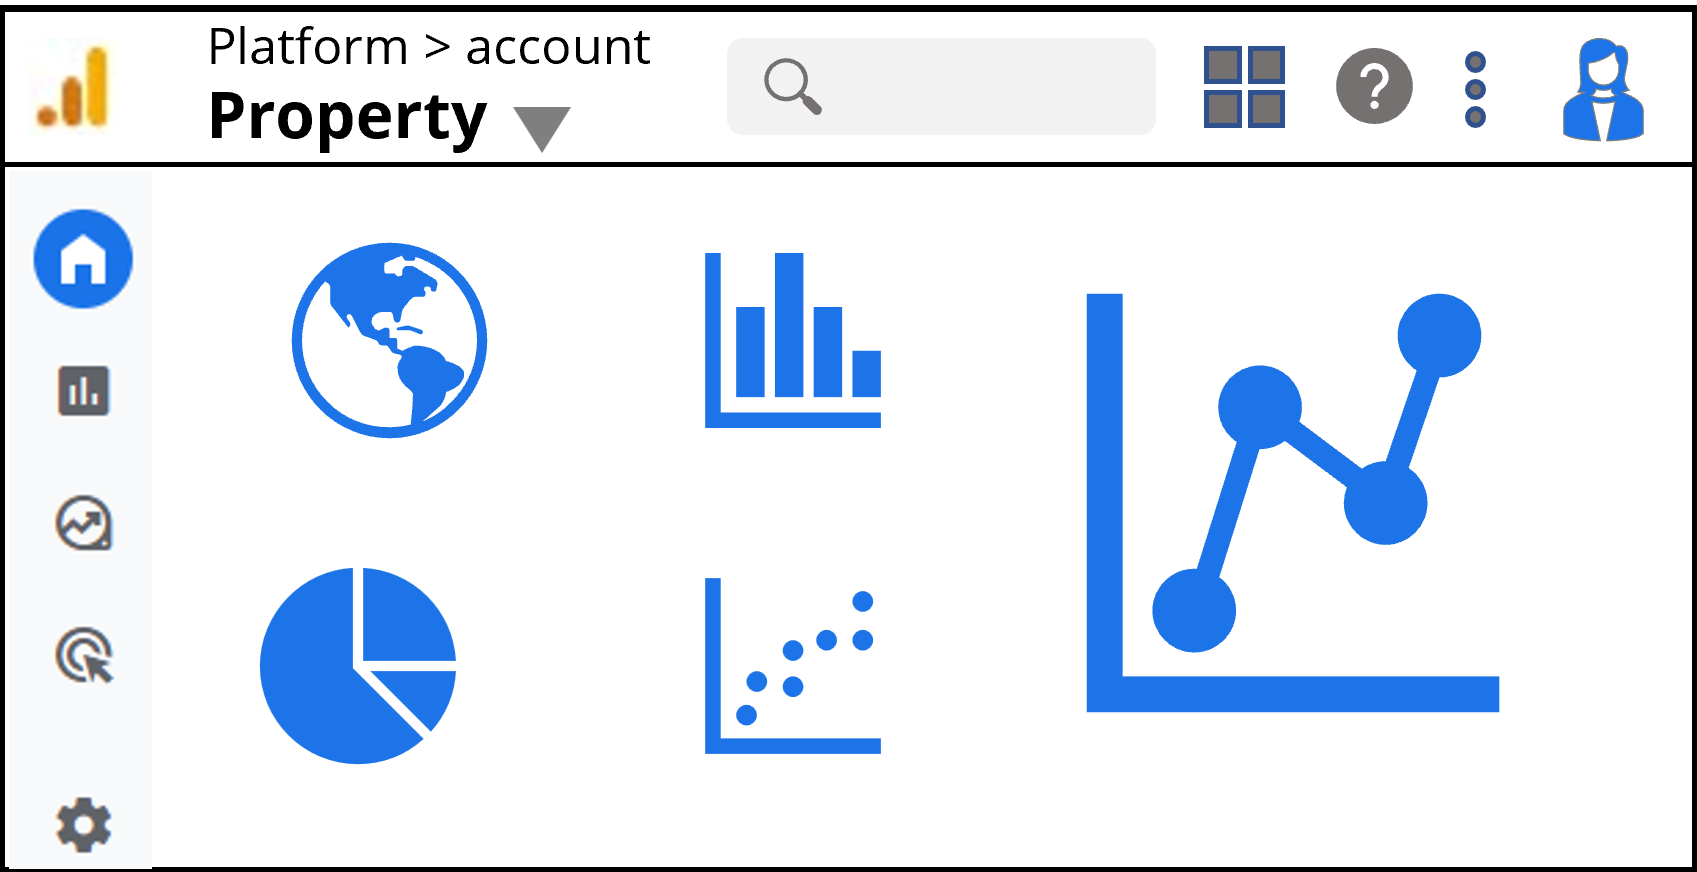
 Top Bar
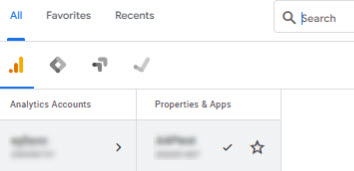
The first interaction we come to shows which account and properties are selected. This lays just to the right of the Analytics logo
 .
.

Select this to view a list of accessible accounts and properties. You can also filter the list by platform (Analytics
, Tag Manager  , Optimize
  , or Surveys
  ).
).
To the left of that is the search bar.
The help icon
 links to Google's Analytics Help website.
Next is the Switch Products icon
 .
.
![Switch Products menu- Platform Home, Analytics, Tag Manager, Explore more products [Campaign Manager 360, Display &Video 360, Optimize, Search Ads 360, Surveys]](resources/images/switchproducts_menu.jpg)
The overflow menu
 includes a GA tour and the ability to send feedback.
The active Google account avatar is the final item in the top bar. Select this to switch and manage Google accounts.
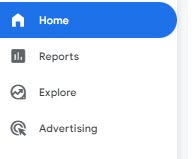
Left MenuThe menu on the left side of the screen expands. Select Home, Reports, Explore, or Advertising to see more options.
At the very bottom of the menu is the Admin icon
 . Select this to open the Admin panel which is explained in greater detail below.
Reports
See Understanding Google Analytics Reports for a full description of report features and customizations. Google provides a list of reports by category with links to supporting documentation. Below is quick look at each item in the Reports menu.
Snapshot vs RealtimeThe Reports snapshot is the overview that first displays when you select Reports. These reports are summaries of data collected over time; therefore, they may lag up to 48 hours behind realtime data. See Customize overview reports and "Reports snapshot" for more information.
Realtime reports, as the name suggests, monitors and displays changes as they happen. Realtime data is limited to the past 30 minutes. These reports are immediately available upon setup and can be used to verify that data is being collected as expected.
AcquisitionAcquisition reports let you know who is interacting with your website. There are three items in the Acquisition reports menu:
- Overview: Report snapshot summarizing acquisition data. This is where you can find the Google Ads campaigns report.
- User acquisition: Reports focused on first time visitors to your site.
- Traffic acquisition: Reports focused on sessions including new and returning visitors to your site.
EngagementEngagement Reports describe interactions on your site such as how long users visit, what they click while on your page, if the number of actions by user or time range is increasing, and more.
- Overview: Report snapshot summarizing engagement data.
- Events: Reports focused on specific interaction types. See About events for more information on the types of interactions tracked.
- Conversions: Reports focused on interactions specified as valuable. See About conversions for more information.
- Pages and screens: Reports focused on the interactions by URL.
- Landing page: Reports focused on the specific page visitors land on when accessing your site.
Monetization- Overview: Report snapshot summarizing monetary transactions on your site.
- Ecommerce purchases: Reports focused on items or services purchased on your site.
- User purchase journey: Reports focused on where users stop the purchase workflow, particularly without finalizing a purchase.
- In-app purchases: Reports focused on purchases made in your app.
- Publisher ads: Reports focused on purchases driven by ad interaction.
- Promotions: Reports focused on purchases driven by incentive promotions.
Retention: Report snapshot summarizing returning users.
Demographics- Overview: Report snapshot summarizing user dimensions such as age, location, gender, and more.
- Demographic details: Reports focused on particular user dimensions such as age, location, gender, and more.
Tech- Overview: Report snapshot summarizing user devices such as browser, screen, operating system and more.
- Tech details: Reports focused on particular user devices such as browser, screen, operating system and more.
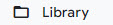
LibraryAccess the reports library from link at the bottom of the Reports menu. The library lets you browse and curate reports and collections of reports.
Explore
Exploration features allow you to apply advanced features and further customize reports. Below are the basic options available in the Explorations panel. We look at these in more depth in Advanced Features and Use Cases.
- Free Form: Use a template to create custom charts and tables.
- Funnel: Use a template to look at specific flows through your website to understand which paths lead to conversion and which lead to drop-off.
- Path: Use a template to look at specific flows through your website.
- Blank: Create your own custom charts and tables using any of the available Techniques from the Exploration Tab Settings. These include Free form, Cohort exploration, Funnel exploration, Segment overlap, Path exploration, User exploration, and User lifetime. See How Exploration works and Create an exploration for more information.
Advertising
These reports require a linking your Google Ads account to your GA4 property. To learn more see Get started with Advertising and Your guide to Google Ads.
Admin panel
The Admin panel is divided into Account and Property sections.
AccountThese settings apply to your Google Analytics (GA) account, not your Google account.
- Account Settings: Manage your account name, data sharing settings, and data processing terms.
- Account Access Management: Set permissions for account access.
- All Filters: Only applies to Universal Analytics.
- Account Change History: A log to track changes to your account.
- Trash Can: You can restore data removed in error.
PropertyThis is an extensive section from which you can access the Setup Assistant, manage properties, define data streams, create events, and much more.